
Grid Frequency
Looking at 1-second data over many years. Analysis updated to end-April 2025.

Prompted by Kathryn Porter’s blog on Grid frequency drifting outside operational limits implies the system is running at the margins on 23 December 2024 where she published the shocking results of her analysis of NESO’s supply of electrical power at the specified frequency of 50 Hz.
Britain’s national energy system operator (“NESO”) has a statutory duty to maintain the frequency with which current and voltage varies on the GB grid at 50 Hz +/- 1%. It also has an operational range which it may only exceed for 1500 minutes per year of +/- 0.4%. I have been surprised to discover just how often the operational limits have been breached. And in December 2023, the statutory limit was breached with little fanfare.
Porter’s work was with Microsoft Excel and due to limitations of Excel’s capability to handle large quantities, the some munging required in her analysis:
I should also mention that the data are very flaky, particularly more recently. There are a lot of data outages ie gaps in the reporting, and there are also multiple occurrences of zero values appearing. In order to smooth these out, I replace missing or zero values with either data the previous interval, or, if there are multiple zero or missing data points, I took the average of the previous and subsequent real values and populated the missing spaces with those. This is somewhat arbitrary, but Excel does not deal well with gaps in time series, and empty or spurious zero valued cells would skew the data, implying there were limit breaches when probably there were not. This means I essentially assume that at none of the times where data were missing or zero there was an actual limit breach, so the results tend towards being on the conservative side.
I decided to scratch my itch to do some number crunching and use a different tool which can cope with massive amounts of data. From NESO’s data portal I downloaded 1-second System Frequency table from 2014 through (as of now) January 2025. Using some simple Python Pandas tools approximately 360 million 1-second data records was loaded into Pandas “dataframes” from which analysis can be conducted. Eventually I’ll post the Python code here.
Initial Results
Edit 12 May 2025: When new data from NESO available, will update these results.
An interesting result, at least to me, is the increased “bifurcation” of frequencies as shown in histograms for each year. The “wideness” of the bifurcation seems to be increasing over time. I don’t know the implications of this on the grid. But it looks like they don’t often hit the 50 Hz target. Also, I have not yet found any missing data.
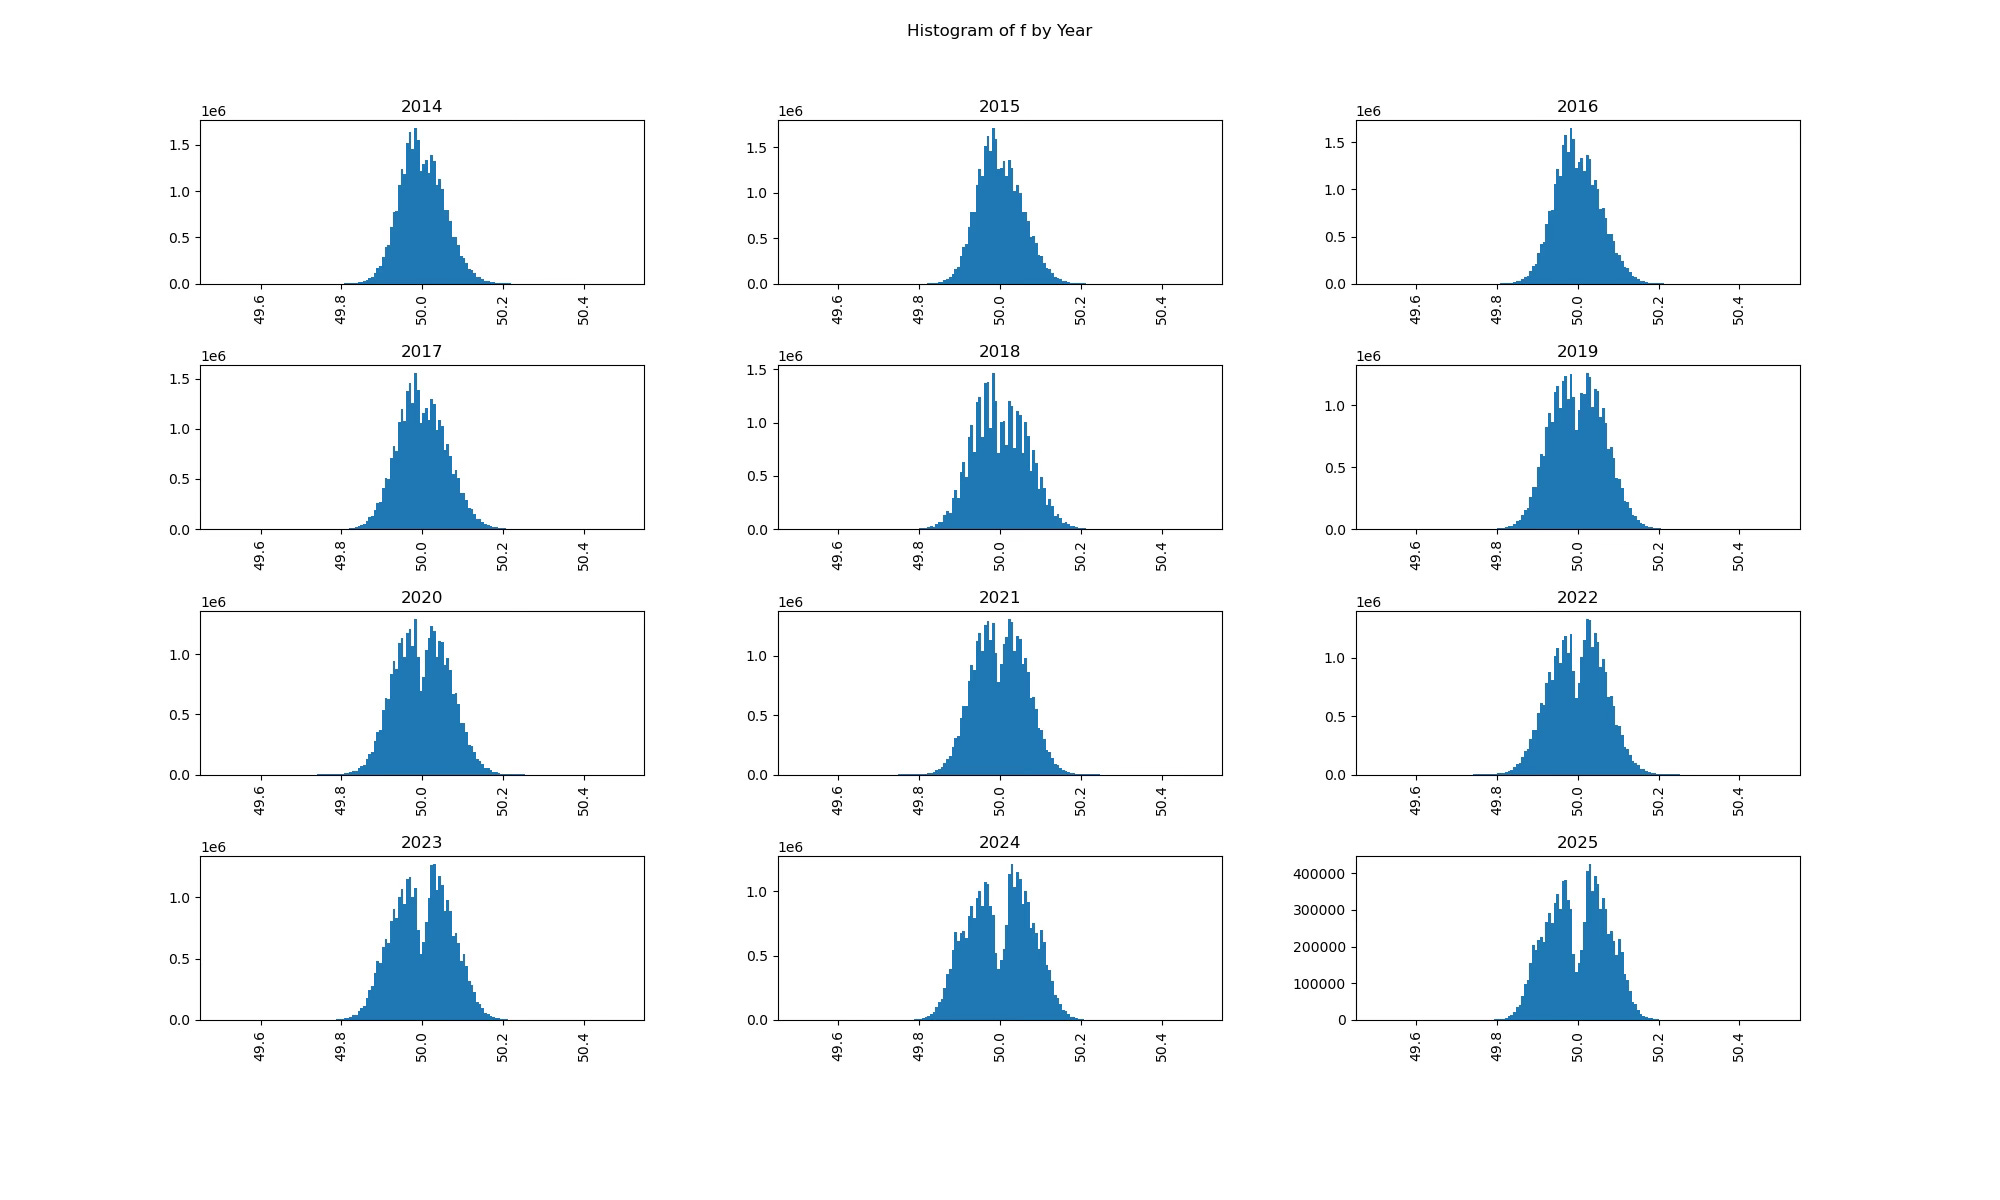
The above figure shows histograms of all data inside a calendar year from 2014. The 2015 year is limited to January.
Edit 12 May 2025: The above graphs updated to include through end April 2025.
I don’t yet know the implications of this on the grid. But it looks like they don’t often hit the 50 Hz target.
A commenter on Porter’s blog, “It Doesn’t Add up” kindly gave some pointers for my future work which will be reported here.
Interesting stuff. The annual level charts show the effects of transition between the analogue methods of frequency control in the early years and the digital battery support that has followed. The toothcomb effects on the frequency distribution are almost certainly digital artifacts with in practice a stepped rather than strictly linear delivery of power as frequency varies, although the toothcomb has been tamed somewhat in later years. The lack of prints close to 50Hz is probably the consequence of deadbands in the battery frequency support contracts, and NESO opting to reduce procurement of support with a narrower headband. The result is that frequency wanders until it hits a level at which batteries act to stabilise it.
You can find technical details of the various contracts here
If you look at frequency traces of events that push frequency outside the +/-0.2Hz operating band you can see the stamp of batteries with periods when the frequency oscillates every few seconds while not otherwise trending much. This appears to be an instability caused by the batteries interacting with each other instead of working together to maintain a smooth return to target levels.
If you wanted to do further research I would suggest that looking at whether there is a different apparent policy according to time of day (by hour is probably sufficient granularity), or according to how much inertia there is on the system, perhaps proxied by share of CCGT generation. I believe before renewables became significant there was a tendency to run just below 50Hz in the daytime, with some speeding up overnight to catch up with clock time so that the total number of cycles per day was close to 50x24x3600, keeping clocks that ran on synchronous motors to time. I recall learning at school that it was quite common to have 1-2 minutes of catch-up overnight. During the Texas freeze in 2021 the ERCOT grid was running at least 8 minutes slow at one point.
The other area of interest and what Kathryn has focused on is analysing frequency events when frequency strays outside the operational tolerance band. To get the best handle on that you need to include a few seconds prior to departure from the band to capture the start of any trip and to be able to measure the maximum rate of change caused (which usually occurs at the beginning if an incident), and the extent if the frequency excursions compared with the previously prevailing levels. NESO do eventually provide some report of larger incidents, but these are often at least 6 months in arrears.
Comments and suggestions welcome.